Once an inspection has been entered, the results need to be interpretted and a report issued with recommendations.
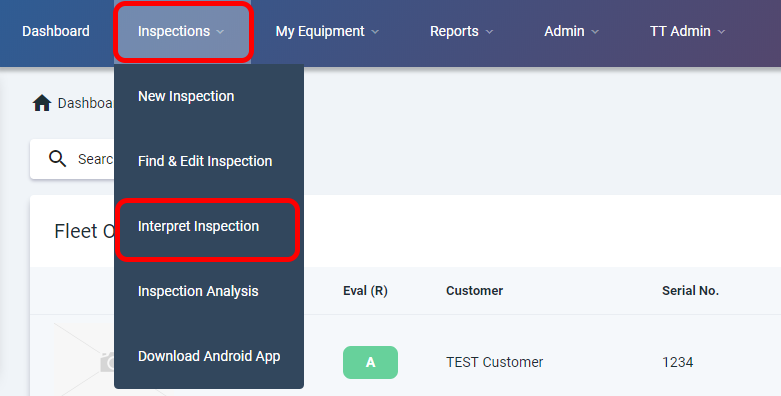
Step 1: Navigate to Interpret Inspection: Inspections > Interpret Inspection
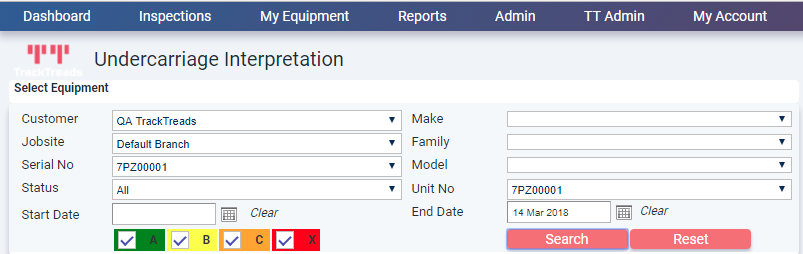
Step 2 : Locate and Open the Inspection
- Find the inspection on this screen by setting selection criteria and hitting ‘Search’ button
- Click on the evaluation code for the particular inspection to be further analyzed.
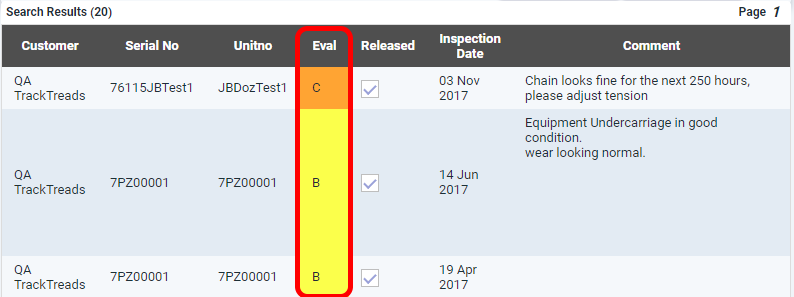
- Once you have clicked on the Eval, the ‘Undercarriage Edit Interpretation’ screen will appear.


Step 3: Read and asses the inspection data.
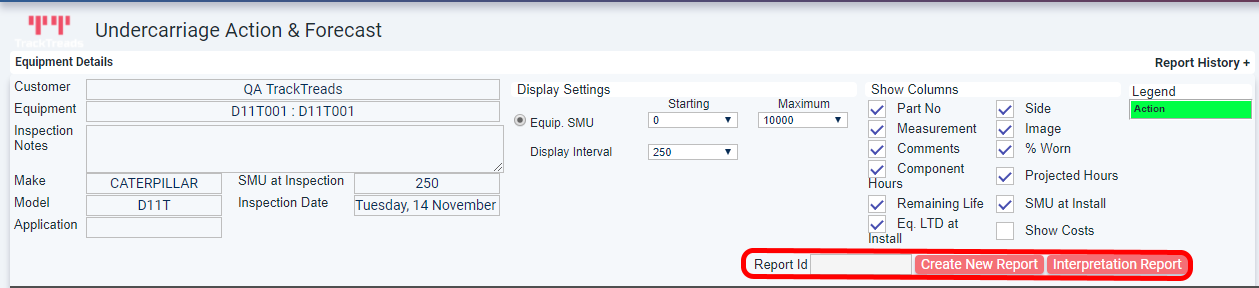
- In the top section ‘Equipment Details’, the display settings can be changed. Use these tick boxes to show or hide what information you want displayed.
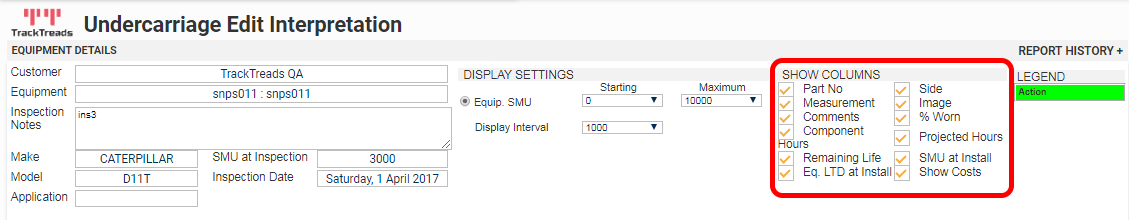
You can also set the SMU range to be viewed. The system will automatically pick the SMU at which the components were installed to set as the minimum or starting SMU.
The system will automatically pick the maximum SMU being the largest component projected hours added to the SMU at installation. The Display interval can be selected and will set the size of the interval between each column on the component display. - Existing photos and comments are indicated by a green camera icon and a light clue comment icon and can be viewed and edited by clicking the icon.
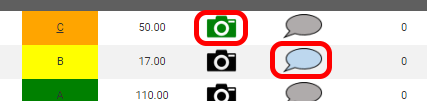
- Additional images and comments for components can be added by clicking the appropriate icon and using the popup forms.
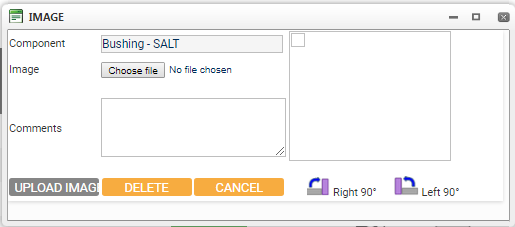
Add Image Popup 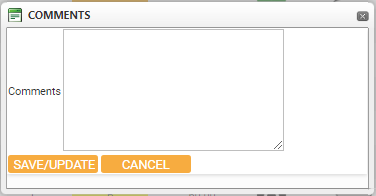
Add Comment Popup - The data fields on this screen have descriptions as follows:-
Position – this indicates the position from front to rear
Side – either Left or Right
Evaluation Code – this is the evaluation based on the percentage worn measurement
SMU at Install – when the component was installed on the machine
Eq. LTD at Install – Life to Date of machine when the component was installed and is a system
generated value
% worn – the measurement is compared against the tables to arrive at a percentage worn
Comp. Hrs – these are the hours on the component wear surface or CMU
Rem Hrs. 100% – hours calculated until the component is 100% worn
Rem Hrs. 120% – hours calculated until the component is 120% worn
Proj. Hrs. 100% – hours calculated for the component full life – life lived plus projected hours to 100% worn
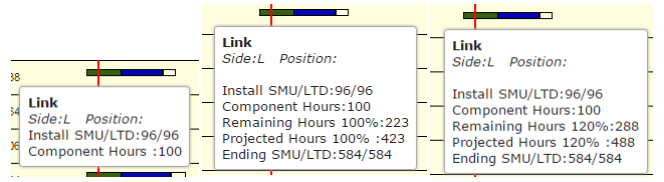
Proj. Hrs. 120% – hours calculated for the component full life – life lived plus projected hours to 120% worn - Graphical Data – The red vertical line indicates an inspection has been performed. Putting your mouse on the line will display the details of this – SMU and Date inspection performed.
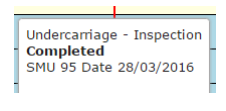 The Bars show – Green (life lived so far), Blue (expected remaining life to 100% worn) and clear (expected remaining life to 120% worn). All data relevant to the component is displayed in the popups, which will show when your mouse is held
over the area of the bar.
- If you have ticked ‘Show Costs’ (see point 4) the Cost and Cost per hour Data columns will be displayed to the right of the graphs.
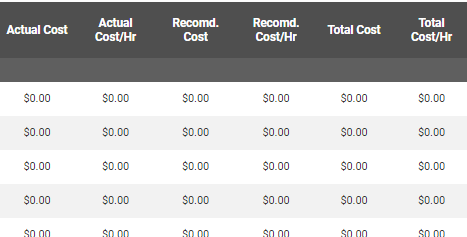
Actual Cost – cost of the currently installed component – can only be entered via the Undercarriage Inspection screen. Shortly to be available on Inspection Details screen.
Actual Cost/Hr – this is the cost divided by the projected hours to 100% worn
Recomd. Cost – this is the proposed recommended action cost
Recomd. Cost/Hr – this is the proposed recommended action cost divided by the hours that would be added to the life of the component
Total Cost – this is the Actual cost plus the recommended action cost
Total Cost/Hr – this is the total life – Actual plus life until recommended action event should take place plus recommended action hours added to life of component.
Step 4: Add Action Recommendations:
- Click on the Component Type line to bring up the component popup.

- Select ‘Add Recommendation’ to bring up the ‘Action Details’ form.

- Pick the event type from the Item Type drop down list
- Note the SMU Start – refer to the projected hours information to find the ending SMU for the action event.

- Enter into the Hours field the extra hours of life this event will add to the component life. The End Equipment SMU for the component will automatically be calculated
- Enter into the Cost field, the recommended cost for performing this action. This is the field displayed in the Recomd. Cost column on the right of the page. The Cost per hour is this cost divided by the Hours field
- Click ‘ADD’
The recommendation is displayed as a green line. Mouse-over to see the details
double click on it to edit the details.

Step 5: Review Component event History.
- Click on the Component Type line to bring up the component popup.
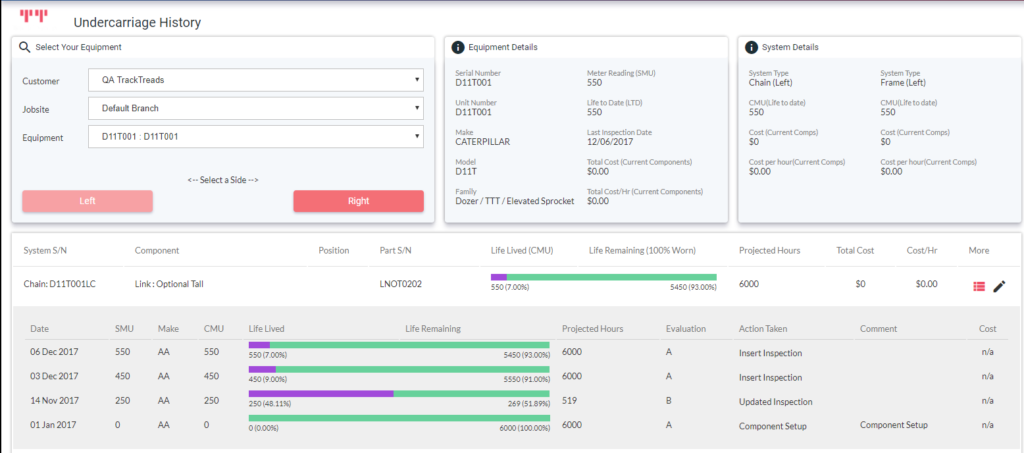
- Select ‘View Component Event History’ to bring up the ‘Undercarriage History’ screen. This screen will show all events in the history of this component position along with date, SMU and CMU

Step 6: Create an overall interpretation comment, evaluation code and issue a Report
- Once all the action recommendations are complete, click on ‘Interpretation Report’ to open the ‘Track Interpretation’ Popup. If the ‘Report ID’ field is blank, click ‘Create New Report’ first.

- On the ‘Track Interpretation’ Popup
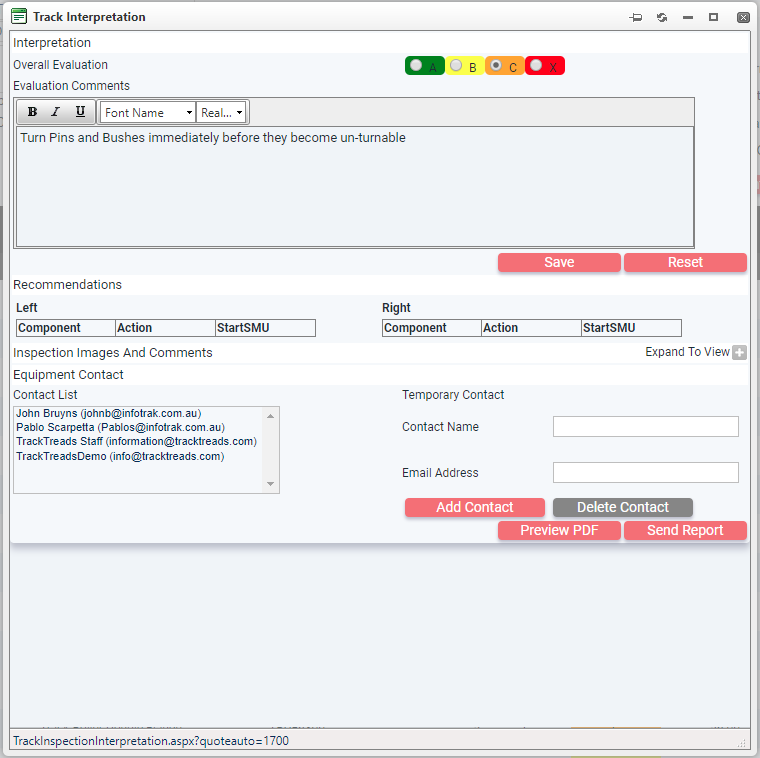
- Check the ‘Overall Evaluation‘ – A, B, C or X and change if required.
- Add any comments into the ‘Evaluation Comments‘ field
- Check the ‘Contact List‘ in the contacts list and add any ‘Temporary Contact‘
- Click on ‘SAVE‘
- Click on ‘PREVIEW PDF‘
- Check the PDF meets the requirements, and if not, close the popup and continue with input in the screen.
- Once complete, open popup again, check and Click on ‘SEND REPORT‘
• The e-mails have now been sent for this interpretation and cannot be retrieved
• The report can be reviewed again in the Undercarriage Analysis screen by both Interpreters and customers.
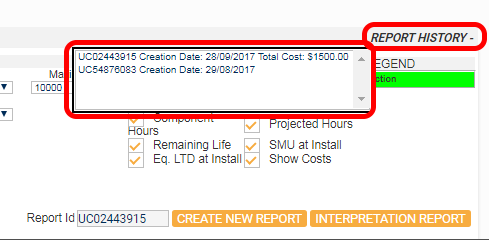
Creating a second report
Multiple reports can be created each containing their own scenario’s. The report available to the customer is the report that would have been generated and sent.
Click on the ‘REPORT HISTORY‘ to view a list of reports already created. Select one and click ‘INTERPRETATION REPORT‘ to view the recommendations of the selected report.